Emmet Friel cyber security blog
Breaking down PUF Analysis Metrics

Prerequesites
This post assumes the reader has basic knowledge of PUFs, Cryptography and Statistics.
Introduction
Working as a non academic engineer in the academic field of PUFs (Physical Unclonable Functions) without a background in cryptography, I found myself facing the daunting task of digesting complex academic papers. It was like trying to decipher Egyptian hieroglyphs. My objective was to evaluate the security of a PUF, but to do so, I needed to grasp the underlying metrics. In this post, I aim to simplify the breakdown of common PUF evaluation metrics from an applied engineer’s perspective.
This post outlines a simple breakdown of common PUF evaluation metrics and their associated mathematical and cryptographic concepts. To accurately evaluate the statistical performance and security of a PUF the following metrics are used:
- Uniqueness
- Min entropy
- Correlation
- CTW
- Uniformity
- Reliability
- Bit-aliasing
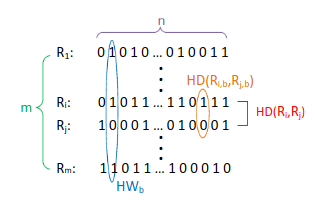
To help provide an illustration of the metrics and the mathematical equations that will follow, the images below will provide a reference:
Background
There are two fundamental mathematical functions by which several important security metrics avail from: Hamming distance and Hamming Weight
Hamming Distance
Hamming distance is a function computed over two binary strings of equal length that returns the number of bits that differ. There are two types of Hamming distance evaluations in the context of PUFs:
- Intra-chip HD
- Inter-chip HD
Intra-chip HD: Represents the reproducibility of each chip. This concerns with how repeatable we get the same output of bits given a certain challenge on a single device.
Inter-chip HD: Represents the uniqueness of each output between a population of devices. For a well designed PUF each individual board should produce its own unique response for a given challenge. This metric evaluates the difference in the responses between devices.
The ideal HD between devices in the context of PUF would have a value of 0.5 indicating that approximately half of the response bits are different between a pair of devices. Given two binary strings $R_i$ and $R_j$ the HD can be evaluated as:
Hamming Weight
The Hamming weight of a bit string is the number of non-zero values i.e the sum of all the logic 1’s. Across a population of $m$ devices the Hamming weight of each bit can be evaluated as:
PUF Metrics
Uniqueness
Uniqueness metric evaluates the ability of a PUF to distinguish a device across an array of identical devices. Effectively its measuring the inter-chip HD across a group of $m$ devices. Ideally you want to evaluate that each response is seen to be unique across devices for a given challenge as this improves the main property of the PUF: unclonability, both from a mathematical perspective as well as physical. Assuming the uniqueness per bit $U_b$ is independent and identically distributed, the uniqueness of a PUF is given as:
\[U = \frac{1}{n} \sum_{b=1}^{n} U_b\]Where $U_b$ is given as:
\[U_b = \frac{2}{m(m-1)} \sum_{i=1}^{m-1} \sum_{j=i+1}^{m} HD(R_{i,b}, R_{j,b})\]If different PUF chips produce similar responses to the same challenge, then an adversary may predict PUF responses using modelling attacks.
Pseudocode for evaluating uniqueness:
- Pairwise comparison of the fractional hamming distance (average HD) across a population of devices.
- Evaluating the base response only (true response)
average_hd = []

for i devices from 1 to m-1
    store base response i
    for j in device i+1 to m
        store base response j
        result = sum both mod 2
        calculate HW of result
        divide HW by bit length to get average HD and append to list

# plot histogram of average_hd
Minimum Entropy
When using PUFs in applications, minimum entropy estimation is essential. Entropy is a measure of the unpredictability in PUF responses, and the minimum entropy is an evaluation of the worst-case scenario. In the context of security evaluation, worst-case analysis is preferable to best case. Using the test suite of the National Institute of Standards and Technology (NIST) specification (SP) 800-90B is currently considered the best method for estimating the min-entropy of PUF responses.
Interestingly, there has been ongoing research into problems using NIST SP 800-90B when evaluating it for two-dimensional data structures such as SRAM PUFs:
First, NIST SP 800-90B is an entropy estimation suite for RNGs that assumes sequential data input. PUFs with an evaluator can intentionally control the ordering of PUF responses by using PUF challenges. Next, the entropy estimation suite of NIST SP 800-90B is known to be unsuitable for two-dimensional memory-based PUFs such as SRAM PUF. The entropy estimation suite is basically designed to operate on one-dimensional data, such as RNGs. There are spatial correlations between responses in PUFs, especially two-dimensional PUFs (e.g., SRAM PUF). Therefore, the approach that concatenates PUF responses obfuscates the spatial correlations and may cause overestimation of PUF entropy. [2]
The $n$-bit responses of $m$ devices have an occurrence probability of $p1$ (logic 1) and $p0$ (logic 0) where:
\[p1 = \frac{HW_b}{m}\] \[p0 = 1- \frac{HW_b}{m}\]Where $HW_b$ is the number of 1’s in $m$ devices. Therefore, the minimum entropy $\widetilde{H}_{min}$ of the design:
\[\widetilde{H}_{min} = \frac{1}{n} \sum_{b=1}^{n}\widetilde{H}_{min,b}\]Where the minimum entropy per bit $\widetilde{H}_{min,b}$:
\[\widetilde{H}_{min,b} = - log_{2}(pb_{max})\]Where the maximum probability, $pb_{max}=max(p_0,p_1)$
The ideal case is where \(\widetilde{H}_{min} = 1\), indicating the probability of a given bit being equal to 0 or 1 is equal \(pb_{max}=0.5\). [1]
GitHub Link: NIST SP800-90B suite
Context Tree Weighting
Previously discussed, the min-entropy is the measure of unpredictability. To evaluate unpredictability of a PUF the CTW algorithm is typically used to calculate the upper bound on the entropy. It represents the ratio of response information before compression and after compression. CTW is a type of statistical method for data compression which basically makes an estimate on the probability of the next bit by using its past history. See this writeup on CTW data compression for more info.
The ideal CTW ratio of a PUF is 100% indicating that it is difficult to compress the response due to its randomness.
The algorithm is typically used among other compressors due to the algorithm approaching source entropy to estimate the secrecy rate of two-dimensional data from fuzzy sources such as biometrics and PUFs. The secrecy rate equals the mutual information between the true response and another measurement. Mutual information quantifies the amount of information obtained from one random variable by observing the other random variable.
It’s also possible to evaluate mutual information using the CTW algorithm. See paper: Comparative Analysis of SRAM Memories Used as PUF Primitives
Correlation
Correlation in the context of PUFs relates to the likelihood of predicting the bit response of one device from the response of another device. Correlation reduces the effort for the adversary to predict the secret generated by the PUF [3]. Correlation is a well-known issue in the field of IC design where neighbouring locations of the die affect each other but in the context of PUFs it is usually known as spatial artifacts or spatial correlation. Two common causes of spatial correlation in IC design:
1. Edge effects:
- This means PUF cells at the edge of an array tend to a certain response due to a change in surrounding structure and can be alleviated through dummy cells around the array that do not contribute to the response.
2. Gradient effects:
- Oxide thickness variations across the whole wafer causes ring oscillators in an RO PUF to tend to a higher frequency in some areas and lower frequency in other areas.
Spatial correlation may occur in SRAM based PUFs where a coupling occurs between the supply voltage line for the cross-coupled inverters in each SRAM cell where the cell draws current until it reaches its final state hence influencing the supply voltage and thus influencing the response of surrounding cells.
Uniformity/Bias
PUF responses should contain ideally the same number of 1’s and 0’s. Uniformity is used to estimate distribution of 1’s and 0’s. For true bit randomness, uniformity will be close to 0.5 but a value 0.5 does not indicate true uniformity as their underlying biases may exist. A value of 1 means that all response bits are a logic 1.
The uniformity of a PUF response of a single device:
\[Uniformity(i) = \frac{1}{n} \sum_{n=0}^{n-1}R_{i,b}\]The average uniformity for a population of $m$ devices:
\[Uniformity = \frac{1}{m} \sum_{i=1}^{m} Uniformity(i)\]An unbiased PUF cell has a uniformity of 0.5
Pseudocode for evaluating Uniformity/Bias:
bias = []
bias_mean []

for i in range from 0 to num_of_devices-1
    get base response of i
    get base response of next device i+1
    sum both mod 2
    calculate HW
    append result to bias

bias_normalized = divide each element in bias by bit length
bias_mean = get mean value of normalized bias

# Print bias mean value
# Plot bias_normalised
Reliability
An ideal PUF should always output the exact response when given the same challenge. However, in practice this isn’t the case due to the small electrical variations in the silicon which may cause a number of the response bits to flip or change. Other factors affect the reliability such as temperature and power supply. The reliability of the PUF can be used to estimate the number of bits which keep a stable value over time. The stability of the PUF is the number of bits in a response which change value from repeating the same challenge over and over.
The greater the reliability of a PUF response, the less costly the error correction required to correct the flipped bits. [4]
Stability can be estimated by evaluating the intra-chip hamming distance. By supplying the PUF with the same challenge over a significant number of measurements $M$ of $n$-bit responses \(R_{m}^{'}\) where $R_m$ is the baseline reference of the $m$-th device:
\[Stability(i) = \frac{1}{M}\sum_{i=0}^{M-1}fHD(R_{i,b},R_{i,b}^{'})\]For a population of $m$ devices, it can be averaged as:
\[Stability = \frac{1}{m}\sum_{i=0}^{m-1}Stability(i)\]The reliability of the $m$-th device can be quantified as the number of bits that are stable over time:
\[Reliability(m) = 1 - Stability(m)\]Bit aliasing
Also known as the bias, this metric investigates how biased each response bit is toward a logic 0 or logic 1. Some PUF response bits could be biased toward one state due to the manufacturing variations which causes the cell to tend to a fixed preferred value. The bias estimation of a particular response $R$ can be evaluated by averaging the response bits generated by all cells at the same location across the number of available devices:
\[Bias = \frac{1}{m}\sum_{i=0}^{R-1}R_{i,n}\]Pseudocode for evaluating the Bit Alias:
- Inspecting the average bit value for each response bit, averaged across all devices
- Evaluating the base response only (true response)
- Ideal value of 0.5
- Row pair wise comparison across devices
bit_alias_vec = []

for i in range from 0 to bit_length
    running_sum = 0
    for j in range from 0 to num_of_devices
        get base response of device j
        running_sum += response bit for that device
    running_sum /= device_num
    append running_sum to bit_alias_vec

calculate min,max,mean values in bit_alias_vec

# Plot histogram of bit_alias_vec
References
[1] Gu, Chongyan & Liu, Weiqiang & Hanley, Neil & Hesselbarth, Robert & O’Neill, Maire. (2018). A Theoretical Model to Link Uniqueness and Min-Entropy for PUF Evaluations. IEEE Transactions on Computers. PP. 1-1. 10.1109/tc.2018.2866241.
[2] Entropy Estimation of Physically Unclonable Functions with Offset Error Mitsuru Shiozaki1 , Yohei Hori2 and Takeshi Fujino3
[3] Gu, C., Chang, C. H., Liu, W., Hanley, N., Miskelly, J., & O’Neill, M. (2021). A large-scale comprehensive evaluation of single-slice ring oscillator and PicoPUF bit cells on 28-nm Xilinx FPGAs. Journal of Cryptographic Engineering, 11(3), 227-238. https://doi.org/10.1007/s13389-020-00244-5
[4] Gu, C., Chang, C. H., Liu, W., Hanley, N., Miskelly, J., & O’Neill, M. (2021). A large-scale comprehensive evaluation of single-slice ring oscillator and PicoPUF bit cells on 28-nm Xilinx FPGAs. Journal of Cryptographic Engineering, page 8, 5.6 Reliability
Useful resources
- https://ebrary.net/29238/computer_science/hardware_security_and_trust_design_and_deployment_of_integrated_circuits_in_a_threatened_environmen
- https://mediatum.ub.tum.de/doc/1612868/1612868.pdf